
How do you read a crypto chart?
A crypto chart shows price over time, usually as candlesticks. Each candle gives the open, close, high and low for one period of trading.
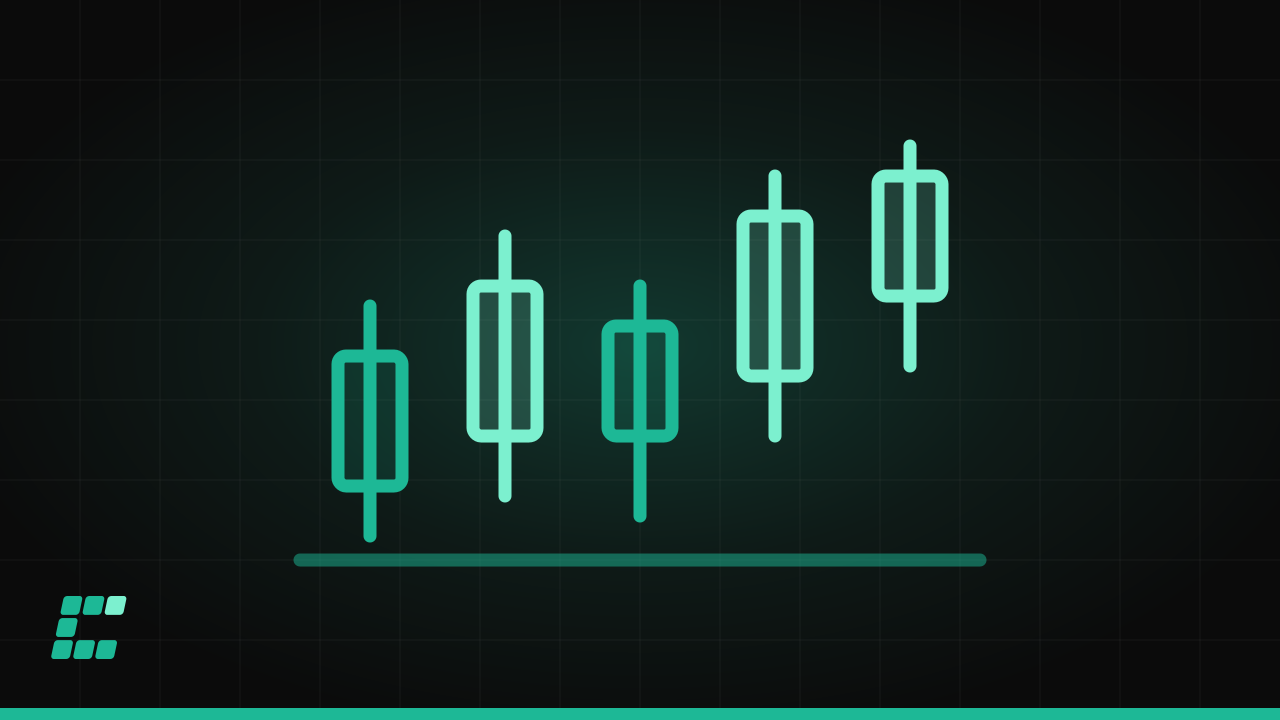
A crypto chart shows how a coin's price has moved over time. Most use candlesticks, where each bar sums up trading in one period: the opening price, the closing price, the high and the low. Charts describe what has already happened. They do not predict what comes next.
How do candlesticks work?
Each candlestick has two parts. The thick section, called the body, spans the gap between the opening and closing prices. The thin lines above and below, called wicks or shadows, reach to the highest and lowest prices of the period.
Color shows direction. A green candle means the price closed higher than it opened. A red candle means it closed lower. A long wick with a small body shows that the price moved a long way during the period and then came back.
What do timeframes and volume show?
The timeframe is how much time each candle covers: a minute, an hour, a day or a week. The same coin can look calm on a weekly chart and frantic on a one-minute chart. Because crypto trades around the clock, a "daily" candle has no natural open or close. Most sites cut the day at midnight in a standard time zone.
Below the candles, most charts show volume bars, which give the amount traded in each period. A price move on heavy volume reflects many participants. A move on thin volume can be the work of a few trades.
What are support and resistance?
Support is a price level where falls have stopped before, because buyers stepped in. Resistance is a level where rises have stalled, because sellers did. Round numbers often play both roles.
Traders also add moving averages, lines showing the average closing price over a set number of days, to smooth out daily noise and show the trend. Trading on patterns like these is called technical analysis, and it is a common tool in crypto trading.
What are the limits of chart reading?
Technical analysis has many critics. They argue that patterns are obvious in hindsight and unreliable in advance, and that any edge tends to vanish once fees are counted. Where a pattern does seem to work, it may be only because enough traders act on the same signal at once.
News can override any chart. A hack, a court ruling or a wave of forced selling can send prices through a support level in minutes, as the guide to why crypto crashes describes.
Charts for small coins deserve extra caution. Volume can be faked through wash trading, in which one party trades with itself to create the look of activity. Sharp spikes can be the visible half of a pump and dump. A chart also says nothing about what a project does or who is behind it, which is a separate question of research.
This guide explains how things work. It is not financial, legal or tax advice. Last updated .